Microsoft Excel is one of the most widely used business tools for data management, reporting, calculations, and analysis. From small businesses to large enterprises, companies rely on Excel to organize information, track performance, manage finances, and improve decision-making.
Even with modern cloud software and AI-powered business tools, Excel remains an essential part of business operations because of its flexibility, simplicity, and powerful data management features.
In this guide, you will learn how businesses use Excel for data management, why Excel is important for companies, and the most common business tasks performed using spreadsheets.
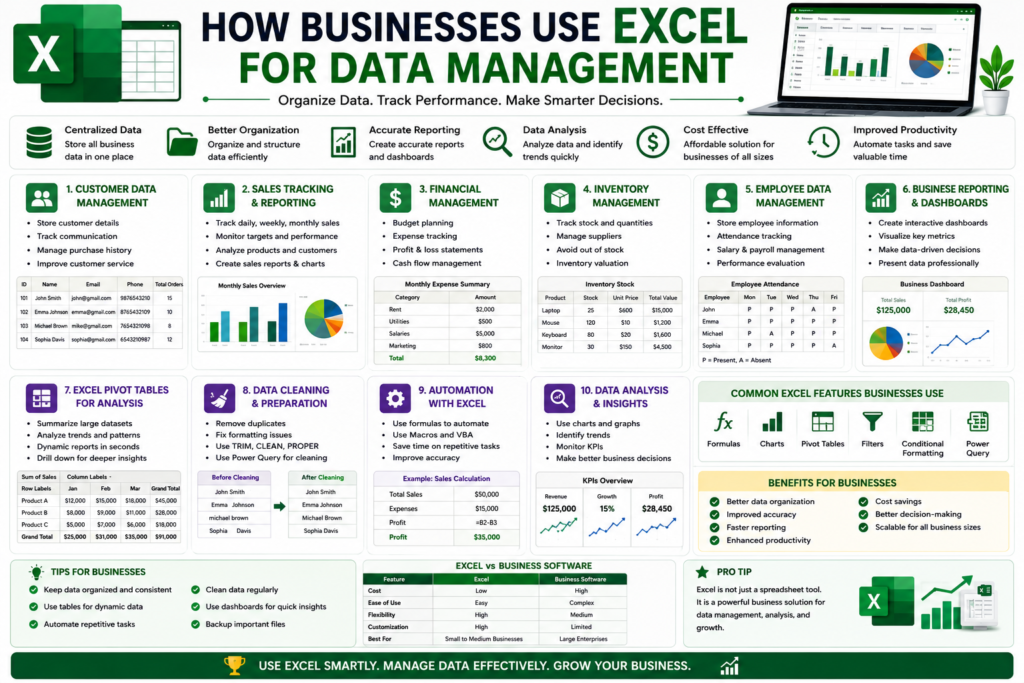
What is Data Management in Excel?
Data management means collecting, organizing, storing, updating, and analyzing information efficiently.
Businesses use Excel to manage:
- Customer records
- Sales reports
- Financial data
- Employee information
- Inventory tracking
- Business analytics
- Expense management
Excel helps businesses organize large amounts of information in structured spreadsheet formats.
Related guide:
“How to Clean Excel Data Quickly”
Why Businesses Still Use Excel
Despite many advanced software tools, Excel remains extremely popular in business environments.
Easy to Use
Excel has a simple interface that beginners and professionals can learn quickly.
Flexible Spreadsheet System
Businesses can create custom:
- Reports
- Dashboards
- Calculations
- Tables
- Data models
Powerful Data Analysis Features
Excel supports:
- Formulas
- Charts
- Pivot tables
- Conditional formatting
- Data filtering
Cost Effective
Many businesses already use Microsoft Office, making Excel easily accessible.
Customer Data Management in Excel
Businesses use Excel to store and organize customer information.
Typical customer spreadsheets include:
- Names
- Phone numbers
- Email addresses
- Purchase history
- Payment records
Benefits
- Easy customer tracking
- Better organization
- Faster search and filtering
- Improved reporting
Small businesses often rely heavily on Excel for customer relationship management.
Sales Tracking and Reporting
Sales departments use Excel to track:
- Daily sales
- Monthly revenue
- Product performance
- Sales targets
- Customer orders
Common Excel Features Used
- SUM formulas
- Pivot tables
- Charts
- Conditional formatting
Excel helps businesses monitor sales performance and identify trends quickly.
Related article:
“Common Excel Formulas Everyone Should Know”
Financial Management Using Excel
Accounting and finance teams use Excel extensively for:
- Budget planning
- Expense tracking
- Tax calculations
- Profit analysis
- Financial forecasting
Common Financial Excel Tasks
- Creating invoices
- Calculating profits
- Managing payroll
- Forecasting revenue
Excel formulas automate financial calculations and reduce manual errors.
Inventory Management in Excel
Businesses use Excel to manage inventory and stock records.
Inventory spreadsheets commonly track:
- Product names
- Stock quantity
- Supplier information
- Product pricing
- Warehouse location
Benefits of Excel Inventory Tracking
- Better stock control
- Reduced inventory errors
- Faster reporting
- Easier product management
Small and medium businesses commonly use Excel instead of expensive inventory software.
Employee Data Management
HR departments use Excel to manage employee records such as:
- Attendance
- Salaries
- Performance tracking
- Shift schedules
- Leave management
Excel HR Features
- Data filters
- Conditional formatting
- Date formulas
- Attendance sheets
Excel helps HR teams organize workforce information efficiently.
Business Reporting with Excel
Businesses create reports using Excel for:
- Sales analysis
- Financial reporting
- Employee performance
- Inventory summaries
- Marketing analysis
Why Excel Reports Are Popular
Excel allows businesses to:
- Create charts
- Build dashboards
- Generate summaries
- Visualize data
Reports help managers make informed business decisions.
Excel Pivot Tables for Data Analysis
Pivot Tables are one of Excel’s most powerful business features.
They help businesses:
- Summarize large datasets
- Analyze sales
- Compare performance
- Create quick reports
Benefits of Pivot Tables
- Faster data analysis
- Better reporting
- Dynamic summaries
- Improved decision-making
Most professional Excel users rely heavily on Pivot Tables.
Data Cleaning in Business Spreadsheets
Businesses often import data from:
- Websites
- CRM systems
- CSV files
- PDF reports
Imported data may contain:
- Duplicates
- Blank cells
- Incorrect formatting
Excel tools help clean data quickly using:
- TRIM formulas
- Remove Duplicates
- Filters
- Power Query
Related guide:
“How to Extract Data from PDF Files”
Business Dashboards in Excel
Excel dashboards help businesses visualize important metrics.
Dashboards may include:
- Sales charts
- Revenue graphs
- KPI tracking
- Business performance indicators
Why Dashboards Are Useful
- Faster reporting
- Better monitoring
- Easier presentations
- Quick decision-making
Managers often use dashboards during meetings and business reviews.
Excel Automation for Businesses
Businesses use Excel automation to reduce repetitive work.
Common Automation Tools
- Formulas
- Macros
- VBA scripts
- Power Query
Automation improves:
- Productivity
- Accuracy
- Workflow efficiency
Large companies often automate repetitive spreadsheet tasks.
Common Excel Features Businesses Use
| Excel Feature | Business Use |
|---|---|
| Formulas | Calculations and analysis |
| Pivot Tables | Reporting and summaries |
| Charts | Data visualization |
| Filters | Data organization |
| Conditional Formatting | Error detection |
| Power Query | Data cleaning |
| Macros | Automation |
These features make Excel extremely powerful for business operations.
Advantages of Using Excel for Data Management
Improves Productivity
Excel speeds up business reporting and calculations.
Better Data Organization
Businesses can structure large datasets efficiently.
Cost Effective Solution
Excel is cheaper than many enterprise software systems.
Flexible Reporting
Custom reports and dashboards are easy to create.
Easy Data Analysis
Businesses can analyze trends and performance quickly.
Challenges of Using Excel in Business
Although Excel is powerful, it also has limitations.
Human Errors
Manual data entry mistakes can affect reports.
Difficult Collaboration
Large teams may face version-control issues.
Large File Performance
Very large datasets may slow down spreadsheets.
Security Risks
Sensitive business data requires proper protection.
Businesses often combine Excel with cloud tools for better collaboration and security.
Excel vs Business Software
| Feature | Excel | Business Software |
|---|---|---|
| Flexibility | High | Medium |
| Cost | Lower | Higher |
| Ease of Use | Easy | Depends on software |
| Customization | Strong | Limited |
| Large Database Handling | Limited | Better |
| Automation | Good | Advanced |
Excel remains one of the most practical tools for small and medium business operations.
Tips for Businesses Using Excel
To improve Excel workflow:
- Keep backup copies
- Use tables and filters
- Clean data regularly
- Automate repetitive tasks
- Use consistent formatting
- Protect sensitive files
Proper spreadsheet management improves business efficiency significantly.
AI and the Future of Excel in Business
Artificial intelligence is rapidly transforming spreadsheet management.
Modern Excel now includes:
- AI-powered analysis
- Smart formulas
- Automated insights
- Intelligent charts
- Data predictions
AI-driven spreadsheets will continue improving business productivity and automation.
Related article:
“Best AI Tools for Image to Excel Conversion”
Conclusion
Businesses use Excel for data management because it is flexible, powerful, cost-effective, and easy to use.
From customer records and inventory tracking to financial reporting and business analysis, Excel helps companies organize data, automate calculations, and improve decision-making efficiently.
Whether you are running a small business or managing large datasets, Excel remains one of the most valuable tools for business data management and reporting.